Agrivoltaics keeps moving from niche trials into real-world scaling. Farmers, developers, and policymakers are treating solar above crops as more than an experimental idea. It is now a practical strategy to increase farm incomes, reduce land-use conflict, and stabilize on-farm microclimates while adding clean generation to constrained grids. This third report brings together the latest facts and studies as of October 2025, highlights policy shifts, summarizes economic signals, and gives practical tables and infographics that a developer, farmer, or policy maker can use today. Key claims are fact checked and sourced. (NREL)
Quick Snapshot: Five Headlines You Should Know
Global solar deployment continues to grow rapidly, but outlooks were adjusted in 2025 because of policy changes in major markets. (Reuters)
Agrivoltaics has a growing evidence base with hundreds of studies cataloged and new international guidance released in 2025. (National Renewable Energy Laboratory)
The European commission and several member states are explicitly including agrivoltaics in solar rollout roadmaps and guidance. (European Commission)
In the United States interest and pilot programs continue despite a short-term pullback in overall solar installs in 2025. Research labs such as NREL remain central hubs for agrivoltaic analysis and community guidance. (SEIA)
The commercial agrivoltaics market is still small relative to utility solar but growing fast with market reports projecting double digit percent increases in 2025. (Research and Markets)


Why Agrivoltaics Matters in 2025
Two pressures are driving interest. First, countries and utilities need more land-efficient solar deployment to meet rising renewable targets and to avoid conflicts with food production. Second, farmers seek diversified revenue and resilience against extreme weather. Combined, those drivers make co-locating PV and crops a practical win-win in many climates when systems are properly designed. These are not only pilot anecdotes. international and national research hubs and policy documents published in 2024 and 2025 explicitly recommend frameworks for dual land use. (IEA-PVPS)
Market and Policy Update (October 2025)
Table 1. Selected Market and Policy Signals, October 2025
| Source | Headline | Implication for Agrivoltaics |
|---|---|---|
| IEA (reported Oct 2025) | Global renewables outlook is trimmed due to policy shifts in the US and China. solar still remains the dominant growth engine. (Reuters) | Policy uncertainty changes incentive structures; agrivoltaics may become comparatively more attractive where land use rules or incentives persist. |
| IEA-PVPS dual land use report (Mar 2025) | Practical guidance and monitoring frameworks for agrivoltaics published. (IEA-PVPS) | Reduces technical barriers and standardizes metrics for performance and compare systems. |
| European commission (Jul 2025) | The innovative solar roadmap includes agrisolar forms and recommends faster rollouts. (European Commission) | Member states receive a clear policy signal to include agrivoltaics in permitting and funding programs. |
| NREL and U.S. labs (2024–2025) | Active research, toolkits, and community engagement programs available. (NREL) | Developers and farmers can access vetted case studies and modelling tools. |
| Market reports (2024–2025) | Market size estimates vary; credible reports show rapid growth from 2024 to 2025. (Research and Markets) | Investor interest and vendor offerings are expanding but fragmentation remains. |
Key takeaway. The policy environment matters more now than it did two years ago. Regions that fold agrivoltaics into their broader solar strategies are moving faster from pilots to commercial projects. (build-up.ec.europa.eu)
Evidence on Crops and Yields
Research is the field where agrivoltaics was once weakest. That has changed. A comprehensive evaluation of published studies shows research is concentrated on crop responses, microclimate changes, and PV performance, with hundreds of studies now available in public portals. The general pattern observed across many temperate and semiarid studies is:
Partial shade reduces heat stress and evaporation in hot, dry climates, often increasing water-use efficiency. (National Renewable Energy Laboratory)
Shade-tolerant and partial-shade crops such as leafy greens, berries, and certain herbs often match or exceed open-field yields under elevated and well-designed PV arrays. (National Renewable Energy Laboratory)
High-light staple crops like corn and sunflowers can suffer yield penalties unless arrays are elevated, widely spaced, or use dynamic tilt. Careful layout and crop choice are essential. (National Renewable Energy Laboratory)
Table 2. Common Crop Responses (Synthesis of Published Studies)
| Crop Type | Typical Response Under Well-Designed Agrivoltaic | Notes |
|---|---|---|
| Leafy greens, microgreens | Neutral to positive yield, longer shelf life | Benefit from reduced heat stress and irrigation savings. (National Renewable Energy Laboratory) |
| Berries, strawberries | Neutral to positive, improved fruit quality in hot climates | Shading reduces sunscald. (National Renewable Energy Laboratory) |
| Root crops (potato, carrot) | Mixed | Depends on depth, harvest system, and light regime. (National Renewable Energy Laboratory) |
| Cereals (corn, wheat) | Risk of yield loss unless high-clearance or sparse arrays used | Design critical; more suitable when paired with grazing or hay. (National Renewable Energy Laboratory) |
A practical implication is that agrivoltaics is not a universal substitute for open-field production. It is a system choice that should be matched to climate, crop, and local market needs.
Technology and Design Trends in 2025
Design diversity is increasing. Common technical trends now observed in commercial pilots and studies include:
Elevated racking to allow farm machinery and mechanized harvests.
Semi-transparent or bifacial modules to balance light transmission and generation.
Dynamic or adjustable tilt and row spacing to tune sunlight for crop stages.
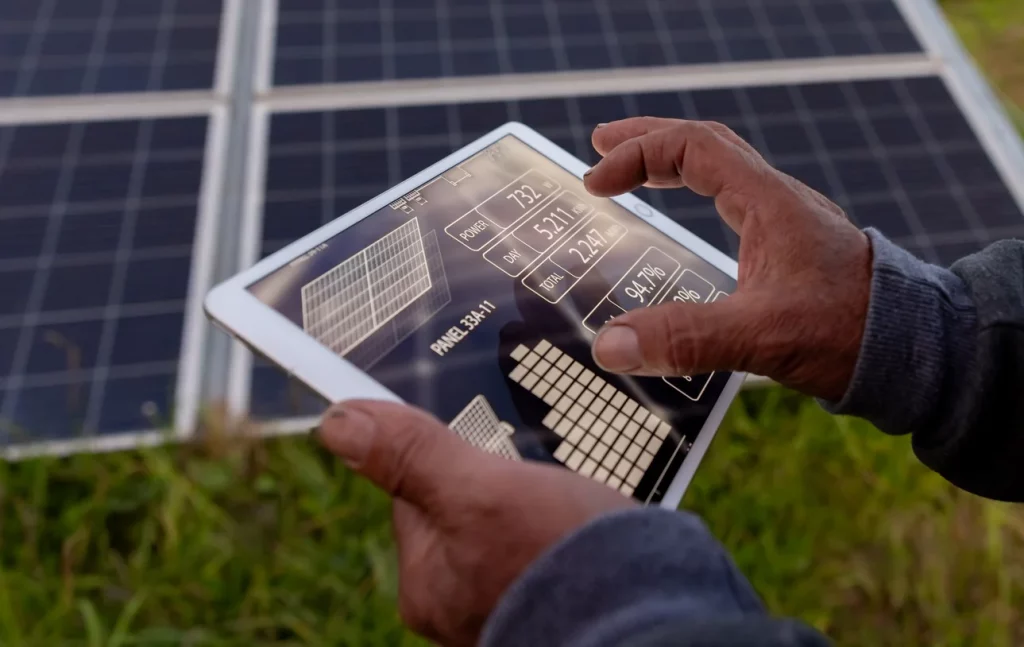
Integrated sensors and monitoring to quantify shading, soil moisture, and panel soiling. (IEA-PVPS)
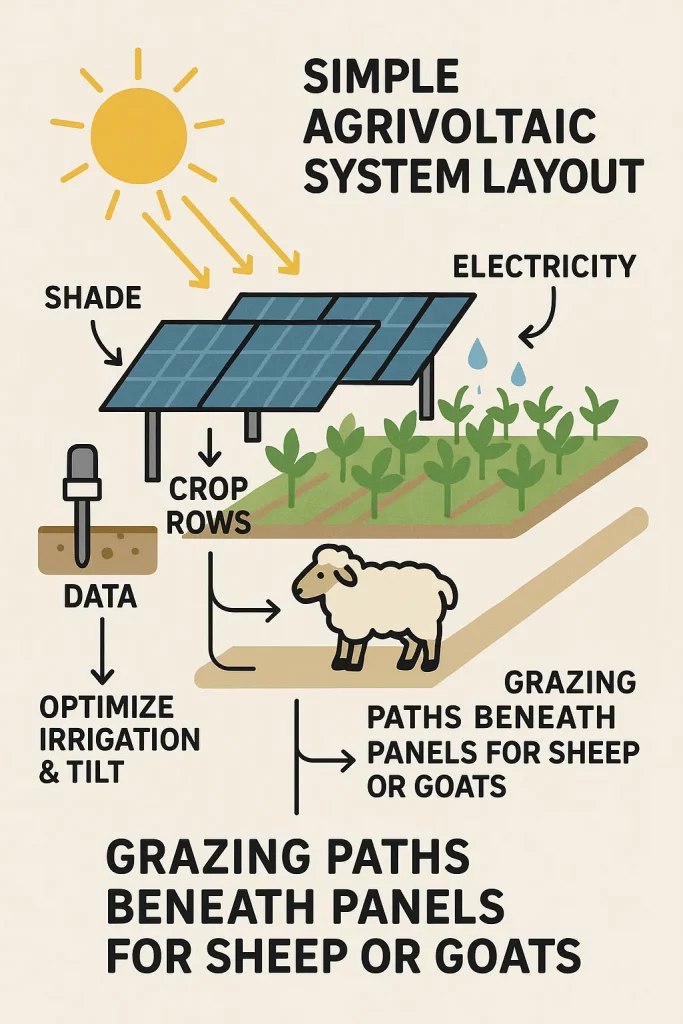
This mini diagram illustrates common elements: panel rows, crop rows, sensors, and grazing access. Successful systems treat the farm and the power plant as an integrated, instrumented asset.
Economics: Who Wins and How Payments Look
Investors and farmers evaluate agrivoltaics with mixed revenue streams in mind. Typical income lines are:
Negotiated land lease or revenue share from power sales.
Crop revenue, sometimes higher per hectare for high-value crops.
Optional ecosystem services payments such as pollinator habitat credits or water savings.
Reduced farm input costs where shade reduces irrigation needs.
Market size estimates vary by methodology. One industry report estimated the agrivoltaics market grew from roughly $4.6 billion in 2024 to about $5.2 billion in 2025. Other analysts present different base numbers but all show rapid percentage growth year-to-year. These figures reflect equipment, installation, and systems integration worldwide and should be read as market sizing estimates rather than precise totals. (Research and Markets)
Table 3. Example Simple Farm-Level Annual Revenue Model (Illustrative)
| Revenue Type | Illustrative Annual Value per Hectare | Comment |
|---|---|---|
| Power lease or PPA revenue | $6000–$15,000 | Depends on irradiance, panel density, and contract. |
| Crop revenue | $1000–$10,000 | Depends on crop value; high-value market gardens at top end. |
| Total combined | $7000–$25,000 | Combined revenue often exceeds single-use land rents in favorable setups. |
Note. The numbers above are illustrative. Site-specific modeling and local power prices are required to make investment decisions.
Case Studies and Pilots to Watch in 2025
NREL-led and U.S. university pilot programs providing open toolkits and data for replication. (NREL)
New EU member state pilots and roadmap-linked demonstrations following the european commission guidance from 2025. (European Commission)
Multiple U.S. regional pilots where developers and farms combine grazing, pollinator strips, and market gardens to stack revenue. Reporting in October 2025 shows growing farmer interest despite headwinds to overall solar installs. (CleanTechnica)
Implementation Checklist for Developers and Farmers
Table 4. 10-Point Pre-Development Checklist
| Step | What to Verify |
|---|---|
| 1. Site suitability | Irradiance, slope, soil, and hydrology |
| 2. Crop match | Choose shade-tolerant or high-value crops suitable for local climate |
| 3. Racking design | Enough clearance for machinery and future operations |
| 4. Contract model | Lease vs revenue share vs joint ownership |
| 5. Grid access | Interconnection capacity and cost |
| 6. Permitting | Local land use rules and EU or national guidance if applicable |
| 7. Monitoring plan | Sensors for PV and crop performance |
| 8. Operations plan | Cleaning, pest control, grazing management |
| 9. Community engagement | Farmer workshops and neighbour agreements |
| 10. Financial model | Conservative revenue cases and downside stress tests |
Use this checklist as a starting point. The iea-pvps dual land use guidance gives more technical depth on monitoring and performance metrics. (IEA-PVPS)
Risks and Regulatory Pain Points
Agrivoltaics faces several non-technical barriers in 2025:
Inconsistent permitting and classification of dual-use land. Many frameworks still treat a site as either agricultural or industrial, which complicates taxes and incentives. (European Commission)
Financing complexity for hybrid assets that do not fit existing lending or insurance products. (Research and Markets)
Grid and market headwinds in places where federal incentives or trade policies changed in 2025, reducing near-term solar project economics. These macro changes led to the IEA to revise parts of the renewable outlook in October 2025. (Reuters)
Addressing these barriers requires aligned policy signals, lender products adapted to dual-use cashflows, and clear community-level agreements.
What to Watch Next
Whether national and subnational incentive programs explicitly include agrivoltaics in 2026 funding cycles. The EU roadmap and national pilots are the test cases. (build-up.ec.europa.eu)
New commercial product offerings such as higher-clearance racking and integrated agronomy sensor stacks. These reduce operational friction. (IEA-PVPS)
Standardized monitoring datasets that allow apples-to-apples comparisons of yield and generation. The 2025 iea-pvps report advocates database expansion. (IEA-PVPS)
Conclusion
Agrivoltaics in October 2025 sits at the intersection of strong technical foundations, growing policy recognition, and uneven but accelerating commercial interest. The evidence base is more mature than two years ago. key public institutions such as NREL and iea-pvps have published toolkits and monitoring frameworks that reduce technical risk. At the same time developers and farmers must manage policy complexity and build business models that stack power and agricultural revenue. For those who align crop choice, racking, and contract structure, agrivoltaics increasingly looks like a practical route to diversify farm income and increase renewable generation per hectare in a world where land is a contested resource. (NREL)
Sources and Reading List
Selected primary sources used in this report:
NREL agrivoltaics research and program pages. (NREL)
iea-pvps dual land use report, March 2025. (IEA-PVPS)
Reuters coverage of IEA outlook revisions, October 2025. (Reuters)
SEIA solar market insight Q3 2025 (US installs context). (SEIA)
Researchandmarkets agrivoltaics global market report 2025. (Research and Markets)
NREL comprehensive evaluation of agrivoltaics research. (National Renewable Energy Laboratory)
European commission documentation and 2025 creative solar roadmap. (build-up.ec.europa.eu)