
Introduction
The solar market and industry continued to demonstrate resilience and record-setting performance throughout 2025, even as policy uncertainty, tariffs, supply chain shifts, and rising costs shaped sector dynamics. Utility-scale projects and manufacturing capacity surged, while residential adoption faced headwinds tied to interest rates and module availability. On the global stage, solar PV additions remained robust, supported by record install volumes in major markets including China and the United States. This quarterly wrap-up reviews major developments from Q1 through Q4 of 2025, highlighting deployment, manufacturing, costs, policy impacts, and forecasts for the sector’s trajectory.
Q1 2025: Strong start amid market headwinds
View Full Report Here: SOLAR MARKET INSIGHTS
Record installation volumes but mixed trends
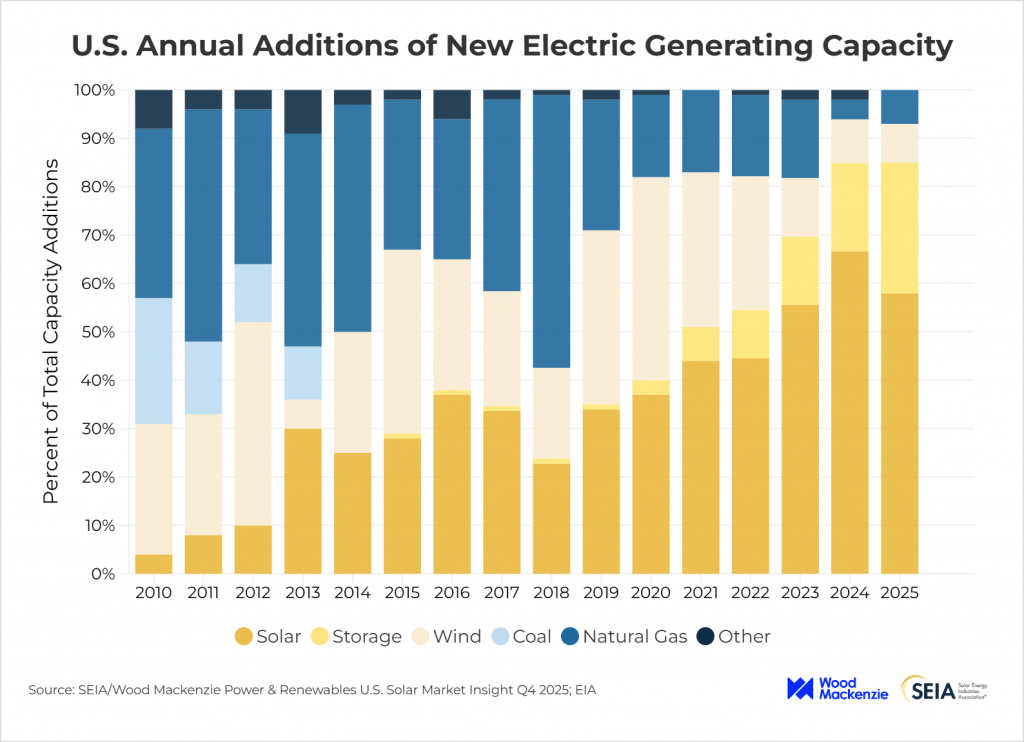
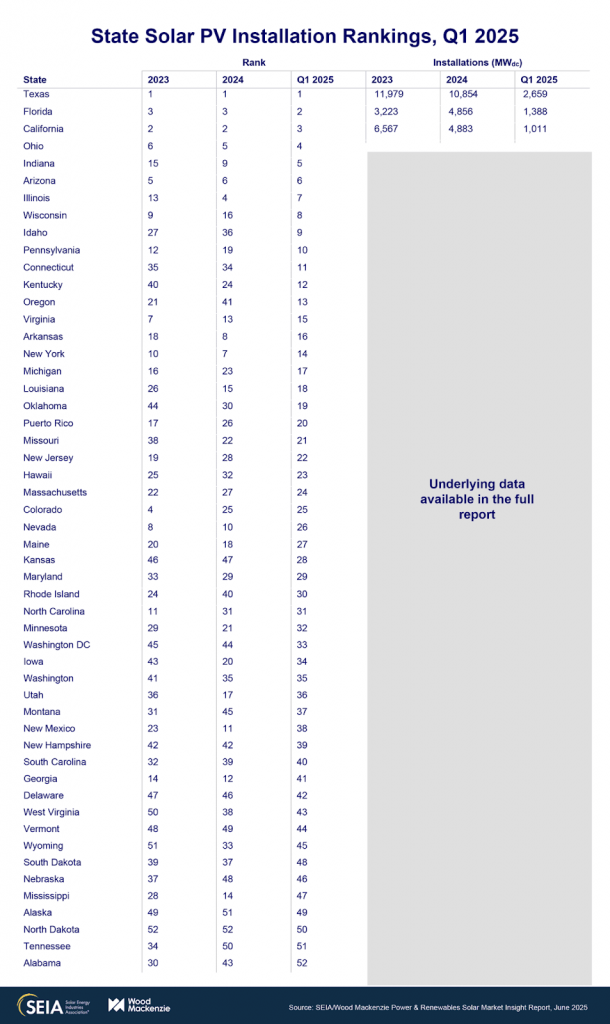
The U.S. solar industry kicked off 2025 with 10.8 gigawatts direct current (GWdc) of new capacity installed, marking one of the largest first quarters on record.1 Solar accounted for 69–82% of all new electricity-generating capacity added to the grid in Q1, underscoring solar’s dominant role in power generation growth.
Deployment highlights
- Utility-scale solar: Utility projects drove the lion’s share of growth, with 9 GWdc installed in Q1. This segment continued to attract investment from corporate buyers and utilities alike.
- Residential solar: Growth showed signs of slowing, with approximately 1.1 GWdc installed, a 13% decrease year-over-year. Higher interest rates and economic uncertainty depressed consumer adoption.
- Commercial solar: This segment bucked the broader decline, posting 4% growth from Q1 2024, driven largely by legacy California Net Energy Metering 2.0 projects coming online.
- Community solar: Q1 saw a 22% year-over-year drop, with 244 MWdc added as projects in Maine and New York slowed after strong 2024 momentum.
Manufacturing gains
The first quarter also marked a meaningful milestone in U.S. solar manufacturing. New capacity additions brought module production capability to 51 GW, a significant increase from previous years. Yet upstream segments like polysilicon and wafer production remained limited.
Policy and trade uncertainty
Trade actions, including 25% tariffs on imports from Canada and Mexico and proposed tariffs on other regions, contributed to market unpredictability. Policy uncertainty, particularly around federal tax credits, was widely cited as a factor dampening installation backlogs and investment commitments.
Q2 2025: Policy headwinds and clearer market signals
Tariff impacts and segment contraction
By mid-2025, rising tariffs and policy ambiguity were affecting all major solar segments. The SEIA’s Q2 report projected modest declines across the industry in 2025, with contractions expected through 2027 before growth resumes later in the decade.
Segment breakdown
- Residential solar: Continued contraction as high rates and tariff pressures suppressed consumer demand.
- Commercial solar: Despite strong Q1 numbers, Q2 projections indicated a modest decline due in part to depleted project backlogs in mature markets. (seia.org)
- Community solar: Forecasters predicted a 22% drop in annual capacity as interconnection delays and regulatory hurdles slowed growth.
- Utility solar: Slight contraction was expected for 2025 after years of growth.
Supply chain and cost pressures
Tariffs imposed on imports from key Asian manufacturing hubs affected module pricing and availability, particularly for residential installers facing tight supply ahead of late-year tax credit deadlines.
Five-year outlook
The SEIA five-year Base Case forecast anticipated an average of ~43 GWdc of solar added annually through 2030, albeit with near-term declines in capacity. Importantly, this forecast excluded potential impacts from ongoing budget reconciliation proposals.


Q3 2025: Seasonal rebound and record growth
Strong deployment despite headwinds
The solar industry bounced back in Q3 with 11.7 GWdc installed, marking the third-largest quarter on record. Combined solar and storage additions in the first nine months topped 30+ GW, with solar making up around 58% of all new U.S. power capacity.
Utility solar leads
Utility-scale projects continued to drive growth, with ~9.7 GWdc of new capacity added in the quarter. Corporate power purchase agreements (PPAs) from tech giants like Meta, Amazon, and Verizon were major contributors to the utility pipeline.
Residential installations dipped about 4% year-over-year, with module availability tight as installers rushed projects ahead of the 2025 Section 25D tax credit deadline. (TaiyangNews – All About Solar Power)
Residential and supply constraints
Residential installations dipped about 4% year-over-year, with module availability tight as installers rushed projects ahead of the 2025 Section 25D tax credit deadline. (TaiyangNews – All About Solar Power)
Manufacturing expansion
The U.S. added nearly 4.7 GW of module capacity in Q3, bringing domestic manufacturing to 60.1 GW. New wafer manufacturing also came online, expanding the domestic value chain, though total production still lags national demand.
Storage and hybrid systems
Solar paired with energy storage, critical for grid reliability, continued to grow as more projects integrated battery systems to manage intermittency and peak demand. While not captured in quarterly install figures alone, storage adoption strengthened solar’s role in grid planning.
Q4 2025: Annual summary and outlook
A banner year, tempered by uncertainty
As the year closed, the cumulative additions in the U.S. placed total 2025 installations well above 30 GWdc, approaching or slightly exceeding 2024’s near-record deployment. Independent analyses projected the U.S. adding ~48–50 GW of solar capacity nationally in 2025, consolidating its position as a top global PV market.
Market share and cumulative capacity
By late 2025, the United States remained one of the largest global solar markets, contributing significantly to a worldwide surge that saw over 380 GW of PV installed in the first half of 2025 alone.
Cost and price dynamics
Module prices rose modestly due to supply pressures and tariffs, with residential system prices increasing, while commercial and utility costs remained stable or declined thanks to technological efficiencies, such as wide adoption of high-efficiency modules.
Policy and regulatory environment
Federal policy uncertainty, including potential changes to tax incentives and continued tariff negotiations, remained the biggest variable affecting near-term installations and investment decisions. Electric interconnection delays and labor shortages also posed ongoing operational risks.
Key themes of 2025
1. Continued leadership of utility-scale solar
Utility projects dominated deployment across all quarters, thanks to large-scale investments, favorable corporate demand, and economies of scale that helped offset tariff-driven cost pressures.
2. Residential market softening
Residential installations declined throughout the year, underscoring sensitivity to interest rates, module availability, and policy signals. Without strong growth drivers or stable tax incentives, this segment lagged behind others.
3. Manufacturing growth countered by supply gaps
Domestic module and wafer manufacturing saw significant capacity growth, but production still fell short of demand. Building out polysilicon and upstream sectors remained a priority for strengthening supply chains.
4. Policy uncertainty shaped investment psychology
Tariffs, trade actions, and prospective changes to federal tax credits drove market caution, illustrating how policy clarity (or lack thereof) can materially affect solar deployment trajectories.
Looking ahead: 2026 and beyond
Analysts project continued strong solar deployment, albeit at slightly moderated annual rates compared to 2024’s record pace. One forecast suggests U.S. solar could approach 737.8 GW of cumulative capacity by 2035, with annual installs continuing above 40 GW through the decade.
Globally, solar’s growth remains robust, as markets in China, India, Europe, and emerging economies accelerate renewable energy deployment to meet climate and energy security goals. International agency reports indicate global installed PV capacity crossed 2.2 terawatts by the end of 2024, with expansion continuing into 2025.
Sources
- Solar Energy Industries Association (SEIA). U.S. Solar Market Insight Report Q1–Q4 2025. https://seia.org/research-resources/solar-market-insight/ (seia.org)
- Solar Power World. U.S. installed 11.7 GW of solar in Q3 2025. https://www.solarpowerworldonline.com/2025/12/the-us-installed-11-7-gw-of-solar-in-q3-alone/ (solarpowerworldonline.com)
- PV Magazine International. U.S. market on course to reach 737.8 GW by 2035. https://www.pv-magazine.com/2025/12/31/u-s-on-course-to-reach-737-8-gw-of-solar-by-2035/ (pv magazine International)
- IEA PVPS. Trends in PV Applications 2025 report. https://iea-pvps.org/trends_reports/trends-2025/ (IEA-PVPS)
- Times of India / global context. Global solar installations surge in first half of 2025. (via news aggregation) (The Times of India)